Flowcharts
An algorithm is a sequence of steps that must be performed to solve a problem.
A flowchart is a way to represent a process or algorithm in a visual, structured and organized way. It is a very useful tool to organize and structure a programming task before jumping directly into the code.
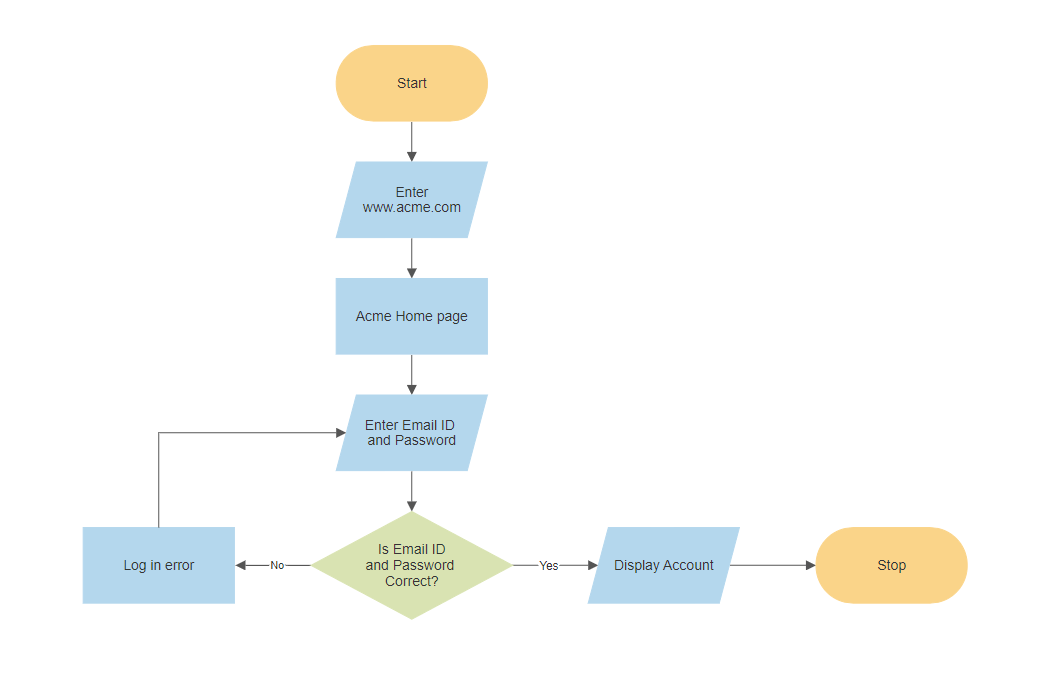
Example of flowchart:
AunqueAlthough existenthere diversosare programasvarious informáticoscomputer paraprograms lafor realizacióncreating deflowcharts, diagramasin dethis flujo,course enwe estewill cursouse utilizaremos una funcionalidad dea PSeInt quefunctionality lothat permite.allows Noit. obstante,However, yand atendiendotaking into account the increasingly abundant scientific evidence in this regard, we recommend that flowcharts be addressed with students first with paper and pen, and if appropriate in a lacollaborative cada vez más abundante evidencia científica al respecto, recomendamos que los diagramas de flujo se aborden con el alumnado en primer lugar con papel y boli, y si es pertinente de forma colaborativaway, dejandoleaving parait elto the software simplementeto susimply ediciónedit finalthem parafinally incluirto comoinclude documentaciónas delprogram programa.
documentation.
Elements of a flowchart
UnA diagramaflowchart deis flujofundamentally estámade formadoup fundamentalmenteof porthe losfollowing siguientes elementos:
elements:
LíneaFlowline:oflechasShowsdeltheflujo:process'sIndicaorderlaofinstrucciónoperation.queItse vais arealizar,lineocominglafromdirecciónonedelsymbolflujoanddelpointingproceso.atMuestra el carácter secuencial del programa.another- Terminal
o inicio y final:EsIndicateslatheformabeginningenandlaendingcualofseaindicaprogramelor“iniciosub-process.delRepresentedproceso”asyan“finalovaldelorproceso”rounded (fillet) rectangle.SuTheyiconousuallysuelecontainsertheunwordrectángulo"Start"conorlas esquinas redondeadas."End"
Asignación/ definiciónProcess:PermiteRepresentsasignaraunsetvalorofooperationsdefinirthatunachangesvariable,value,dondeform,seoralmacenanlocationlosofdatosdata.queRepresentedseasnecesitanapara resolver el problema. Suele representarse con un rectángulo.rectangle.
DatosInputde entradadata:IndicaIndicateslatherecepciónreceptiondeofdatosdataenatlatheentrada.input.SeItrepresentaisconrepresentedunbyrecuadroaconrhomboidlasandesquinasaninclinadasinwardy una flecha hacia dentro.arrow.
DatosOutputde salidadata:IndicaIndicateslaprintingimpresióndatadeondatosoutput.enItlaissalida.representedSebyrepresentaaconrhomboidunandrecuadroanconarrowlaspointingesquinas inclinadas y una flecha hacia fuera.out.
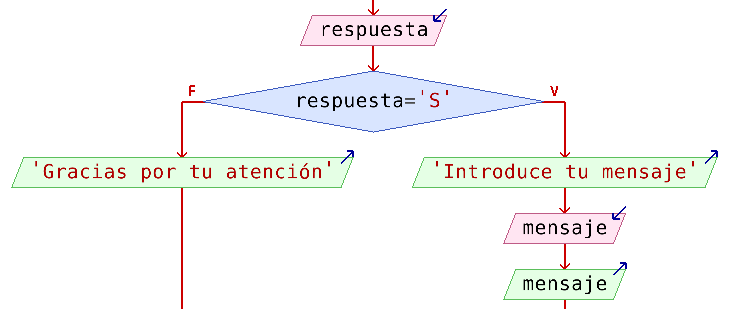
DecisiónDecision:IndicaShowsqueadesdeconditionaleloperationpuntothatendeterminesquewhichnosoneencontramos,ofpuedethehabertwomáspathsdetheunprogramcaminowillparatake.seguir,Thesegúnoperationlaiscondicióncommonlydada.aEnyes/noestequestioncasoorsetrue/falseusatest.unRepresentedrombo.as a diamond.
OtrosOther:ComoLikealgunossometipostypesdeofbucles,loops,losweiremoswillviendoseemásthemadelante.later.
EjemplosSimple sencillosexamples deof diagramas de flujoflowcharts
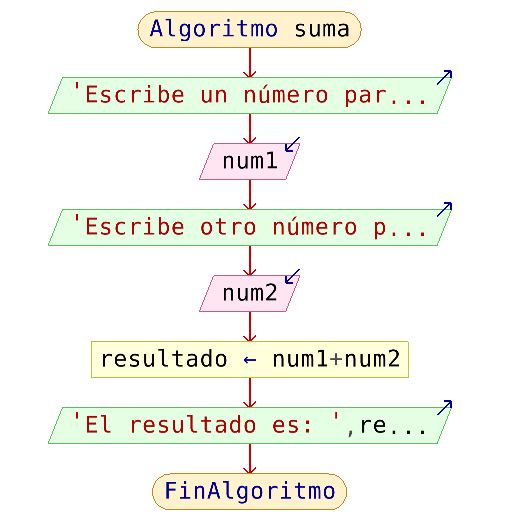
EjemploExample 1: DiagramaFlowchart de flujo de un programa queof a partirprogram dethat dostakes númerostwo losnumbers, sumaadds ythem muestraand elshows resultadothe enresult pantallaon the screen
SOLUCIÓN:SOLUTION:
SalidasOutput:tieneItquemustpedirasklosfordosthenúmerostwoanumberssumar,toyadd,luegoandtienethenqueshowmostrartheel resultado.result.EntradasInput:losthedostwonúmerosnumbersatosumar.addAlmacenamientoStorage:dostwo variablesquetoalmacenenstorelosthenúmerostwoa sumarnumbers (num1 y num2) ,yandunaatercerathirdqueonealmacenetoelstoreresultadothe result (resultado)result)OperaciónProcessing:suma.Addition.
Diagrama de flujo:Flowchart
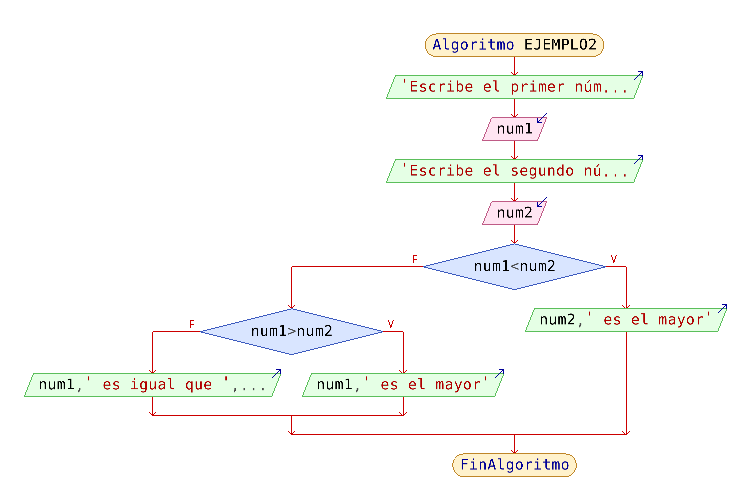
EjemploExample 2: DiagramaFlowchart de flujo de un programa queof a partirprogram dethat doscompares númerostwo comparanumbers cuálwhich esis mayorlarger yand lodisplays muestrait enon pantalla.
the screen.
SalidasOutput:tieneitquemustpedirasklosthedostwonúmerosnumbersatocomparar,compareyandluegothentieneshowquethemostrarresultelofresultadothede la comparación.comparison.EntradasInput:losthedostwonúmerosnumbersatocomparar.compareAlmacenamientoStorage:dostwo variablesquetoalmacenenstorelosthenúmerosnumbersatocompararcompare (num1 y num2)OperaciónProcessing:comparaciónlogiclógica.comparison.
Diagrama de flujo:Flowchart:
{{@5685}}

