Flowcharts
An algorithm is a sequence of steps that must be performed to solve a problem.
A flowchart is a way to represent a process or algorithm in a visual, structured and organized way. It is a very useful tool to organize and structure a programming task before jumping directly into the code.
Example of flowchart:
There are various computer programs for creating flowcharts. Most text processors or slideshow software allow it. However, it is advisable to create flowcharts first with paper and pen, and if appropriate in a collaborative way, and use the software to simply edit them finally to include as program documentation.
Elements of a flowchart
A flowchart is fundamentally made up of the following elements:
- Flowline: Shows the process order of operation. It is a line coming from one symbol and pointing at another
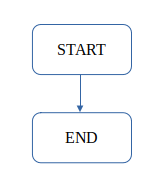
- Terminal: Indicates the beginning and ending of a program or sub-process. Represented as an oval or rounded rectangle. They usually contain the word "Start" or "End"
 Process: Represents a set of operations that changes value, form, or location of data. Represented as a rectangle.
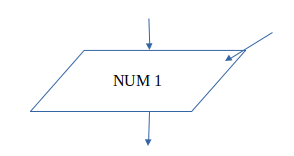
- Input data: Indicates the reception of data at the input. It is represented by a rhomboid and an inward arrow.
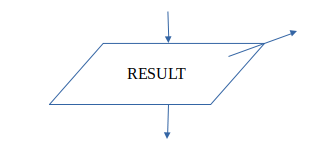
- Output data: Indicates printing data on output. It is represented by a rhomboid and an arrow pointing out.
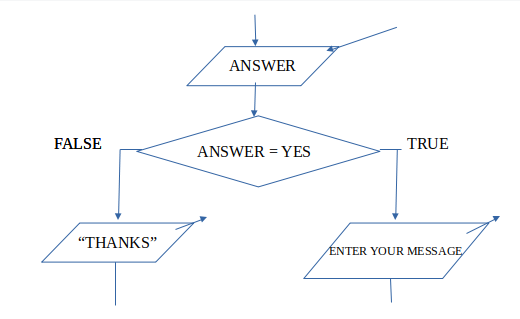
- Decision: Shows a conditional operation that determines which one of the two paths the program will take. The operation is commonly a yes/no question or true/false test. Represented as a diamond.
- Other: Like some types of loops, we will see them later.
Simple examples of flowcharts
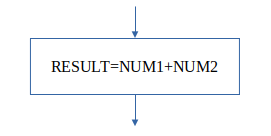
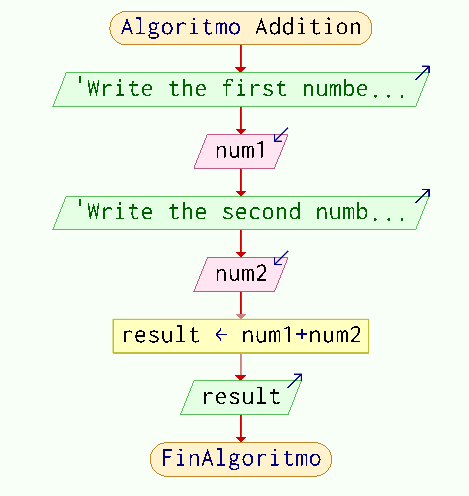
Example 1: Flowchart of a program that takes two numbers, adds them and shows the result on the screen
SOLUTION:
- Output: It must ask for the two numbers to add, and then show the result.
- Input: the two numbers to add
- Storage: two variables to store the two numbers (num1 y num2) , and a third one to store the result (result)
- Processing: Addition.
Flowchart
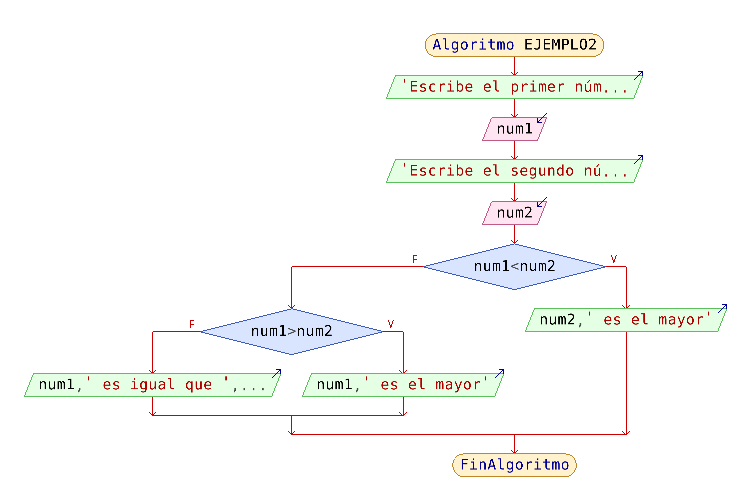
Example 2: Flowchart of a program that compares two numbers which is larger and displays it on the screen.
SOLUTION:
- Output: it must ask the two numbers to compare and then show the result of the comparison.
- Input: the two numbers to compare
- Storage: two variables to store the numbers to compare (num1 y num2)
- Processing: logic comparison.
Flowchart: